Zoning and Housing Supply in Metro Boston
Zhi Ray Wang, MIT Spring 2025
zrwang@mit.edu
Initial Analysis Questions
Housing in Metro Boston is deeply shaped by zoning policies, with single-family zoning acting as a powerful force in defining who can afford to live where. While zoning regulations are often framed as tools for urban planning and community stability, they have long been criticized for contributing to racial and economic segregation. This analysis takes a data-driven approach to understand how single-family zoning impacts household composition, demographics, and economic disparities across municipalities. Through a combination of geographic, demographic, and income data, this study seeks to highlight patterns of exclusion, affordability challenges, and structural inequities embedded within the region’s housing policies.
Through a comparative study of zoning percentages, housing stock composition, and demographic distribution, we aim to answer the following questions:
(1) Which region has the highest single-family zoning rates, and how does that affect housing diversity?
(2) How do income and racial composition vary between high-zoned and mixed-use municipalities?
(3) Are there correlations between household type (family vs. non-family) and housing stock?
(4) Which areas are most vulnerable due to zoning-driven limitations on affordability?
Dataset Overview
This dataset contains statistics for municipalities in Metro Boston, focusing on the differences between single-family zoning and other housing zoning. It includes two primary sets of information:
(1) zoning data: Detailing the percentage of land restricted to single-family housing versus areas that permit multi-family or mixed-use developments.
(2) demographic data: Capturing the population characteristics of those residing in single-family-zoned areas compared to other housing zones.
The dataset allows for an analysis of which regions enforce the highest rates of exclusionary zoning and how this correlates with income, race, household composition, and affordability metrics. Some data transformations have been applied to ensure consistency, including filtering out incomplete records and normalizing zoning percentages. I'm interested in this dataset because it provides a spatial and demographic perspective on zoning restrictions, enabling a deeper exploration of housing accessibility, economic exclusivity, and racial disparities in urban planning.

Geographic Distribution of Single-Family Zoning in Metro Boston
Mapping Zoning and Household Composition in Metro Boston
As an overview, this spatial analysis of zoning restrictions reveals that single-family zoning dominates many municipalities, restricting the housing types available. These policies usually limit the supply of multi-family housing, effectively pushing lower-income residents and non-traditional households out of specific communities. On this map, the darker-shaded areas indicate municipalities where nearly all residential land is zoned exclusively for single-family homes, reinforcing a barrier to housing affordability and diversity.

Household Composition Overview in Metro Boston
Originally, single-family zoning was designed with traditional family structures in mind, prioritizing larger homes for nuclear families. This figure shows the breakdown of households into family and non-family categories. While family households remain the majority, the growing presence of non-family households—such as single-person households and unrelated individuals living together—indicates a demand for more flexible housing options in the market.

Distribution of Family vs. Non-Family Households by Municipality in Metro Boston
Expanding on this, we compare the ratio of family and non-family households across different municipalities. Unsurprisingly, areas with high single-family zoning tend to have a lower percentage of non-family households. Municipalities with a higher percentage of family households tend to correlate with stricter single-family zoning policies, while areas with more non-family households may have more diverse housing options, including multi-family zoning and rental units.
These towns have long been characterized by large-lot zoning and strict land-use regulations that prioritize detached single-family homes, which naturally attract traditional nuclear families rather than individuals or unrelated roommates seeking smaller or more affordable housing options. The restrictive nature of these zoning policies effectively limits the availability of multi-family housing, rental units, and more flexible living arrangements, making it difficult for single professionals, students, or lower-income residents to find housing in these areas.

Population Distribution by Municipality and Age Group in Metro Boston
Demographic Trends Across Municipalities
Zoning policies not only shape household structure but also influence who gets to live in which municipalities.
By analyzing the regional population's age distribution, we can further predict how zoning may have influenced generational composition. Areas with predominantly single-family zoning often have fewer young adults, a likely result of higher housing costs and limited rental options. On the other hand, municipalities with more diverse housing stock tend to support a broader range of age groups, from young professionals to retirees.
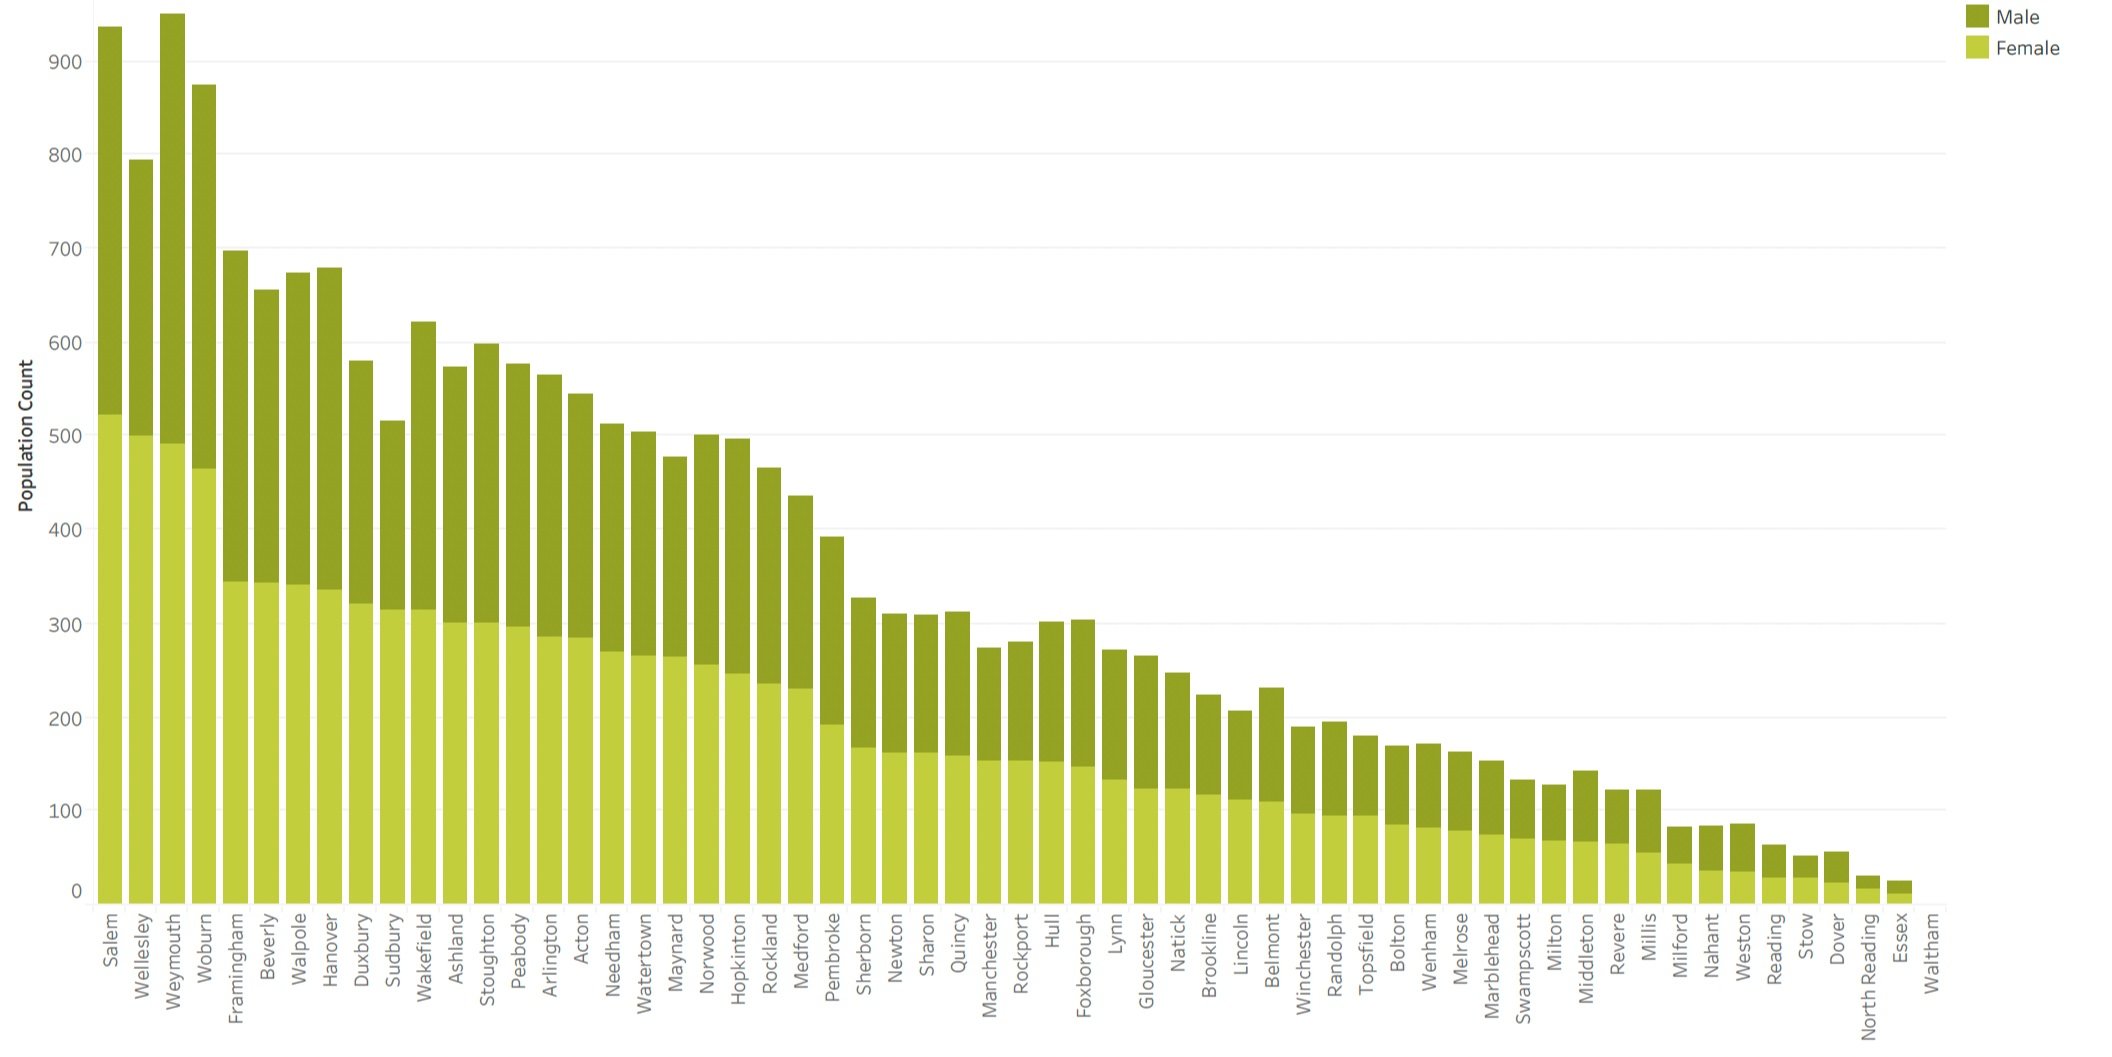
Gender Distribution by Municipality in Metro Boston
Although gender distribution may not seem directly linked to zoning, certain patterns emerge when we look at household structure. Municipalities like Salem, Waltham, and Lynn exhibit a more balanced gender ratio, with slightly higher proportions of female residents. This could indicate a larger presence of single-person or female-headed households.
On the other hand, municipalities with the highest male-to-female ratios, such as Hopkinton, North Reading, and Bolton, are predominantly zoned for single-family housing. These areas tend to have larger family households, often with two-income earners, which aligns with the economic feasibility of affording single-family homes. A higher share of male residents in these municipalities may also be attributed to employment patterns.
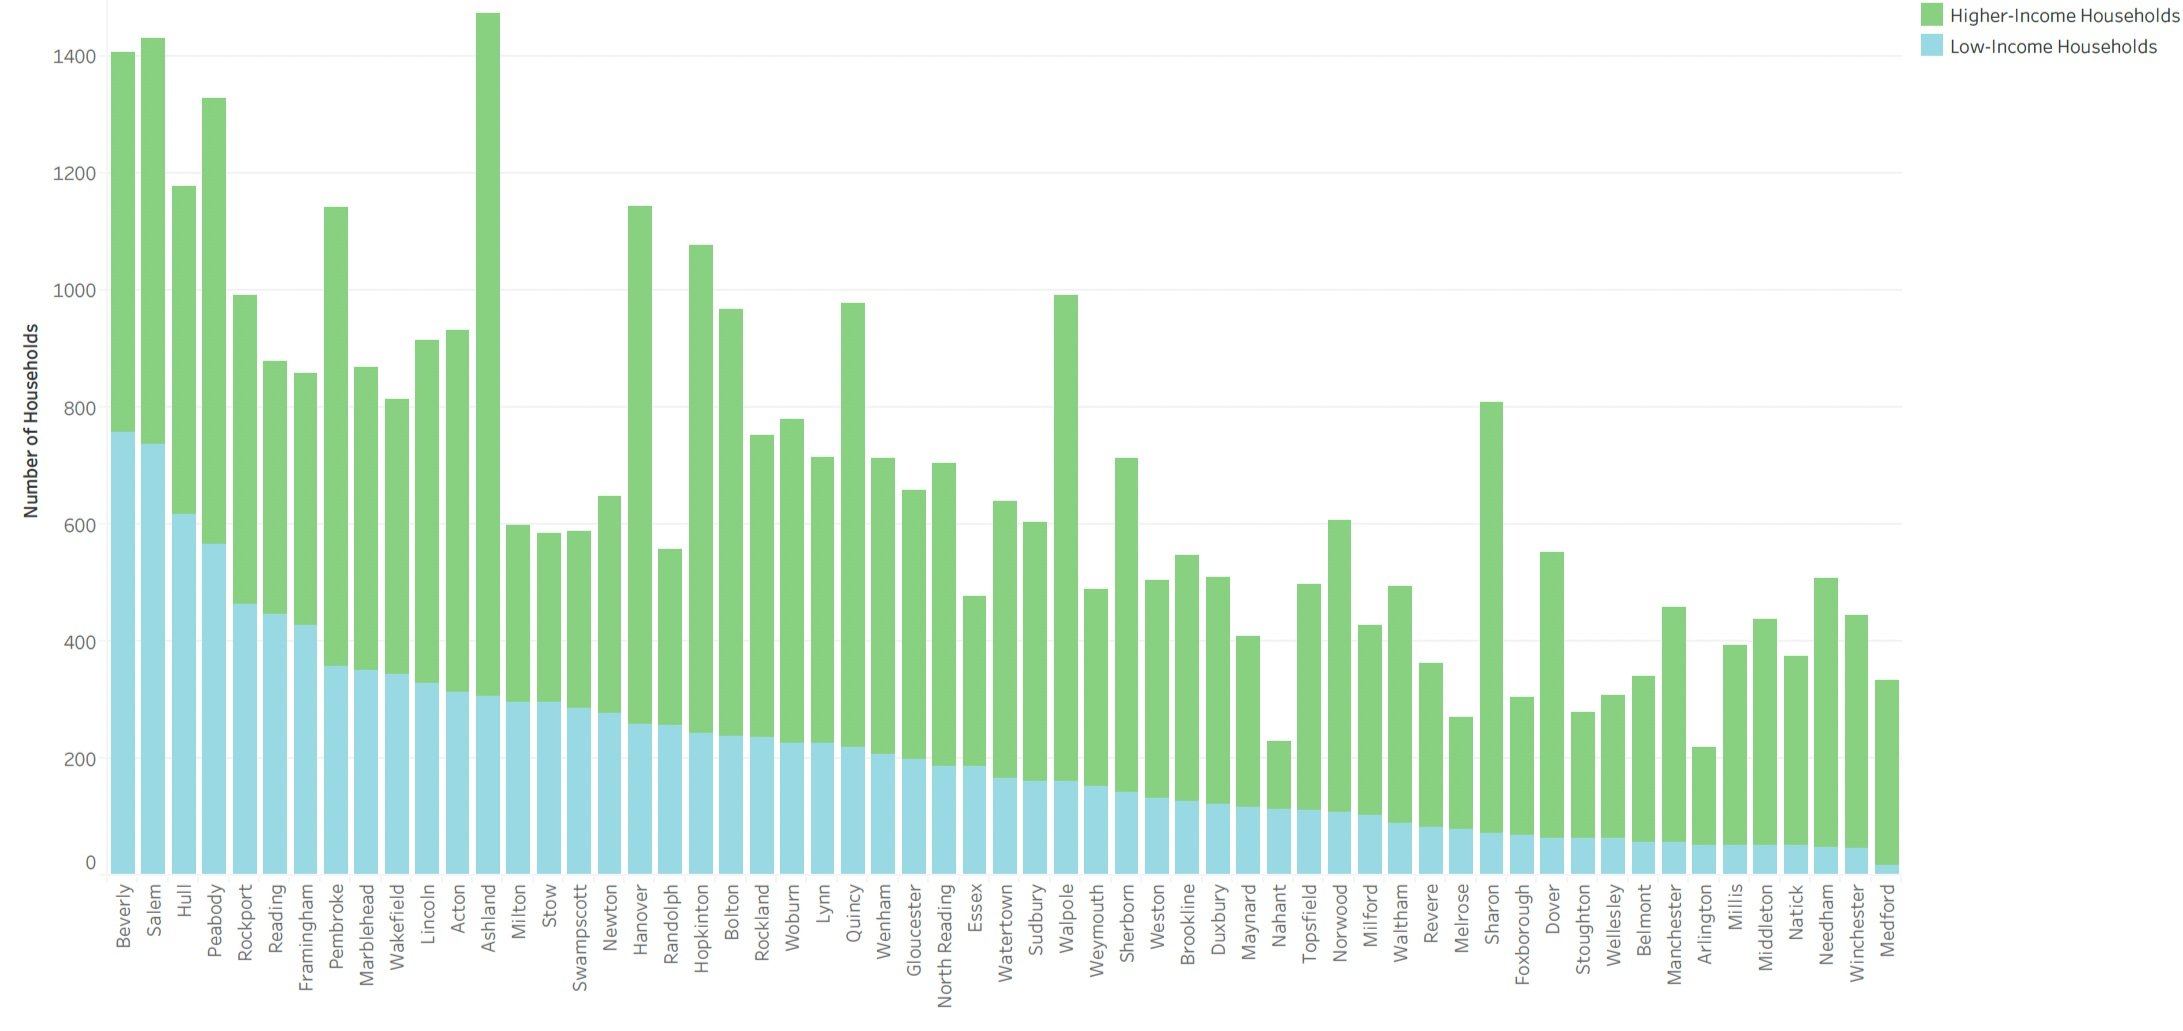
Income Distribution by Municipality in Metro Boston
Perhaps one of the most telling indicators of zoning’s impact is income distribution. This figure compares higher-income and lower-income households across municipalities. (with the threshold of under $75,000 annual household income to distinguish low-income households.) Predictably, municipalities with restrictive zoning tend to have a higher concentration of wealth. Since single-family zoning limits the supply of lower-cost housing options, it creates economic barriers that might potentially exclude lower-income residents from wealthier communities.
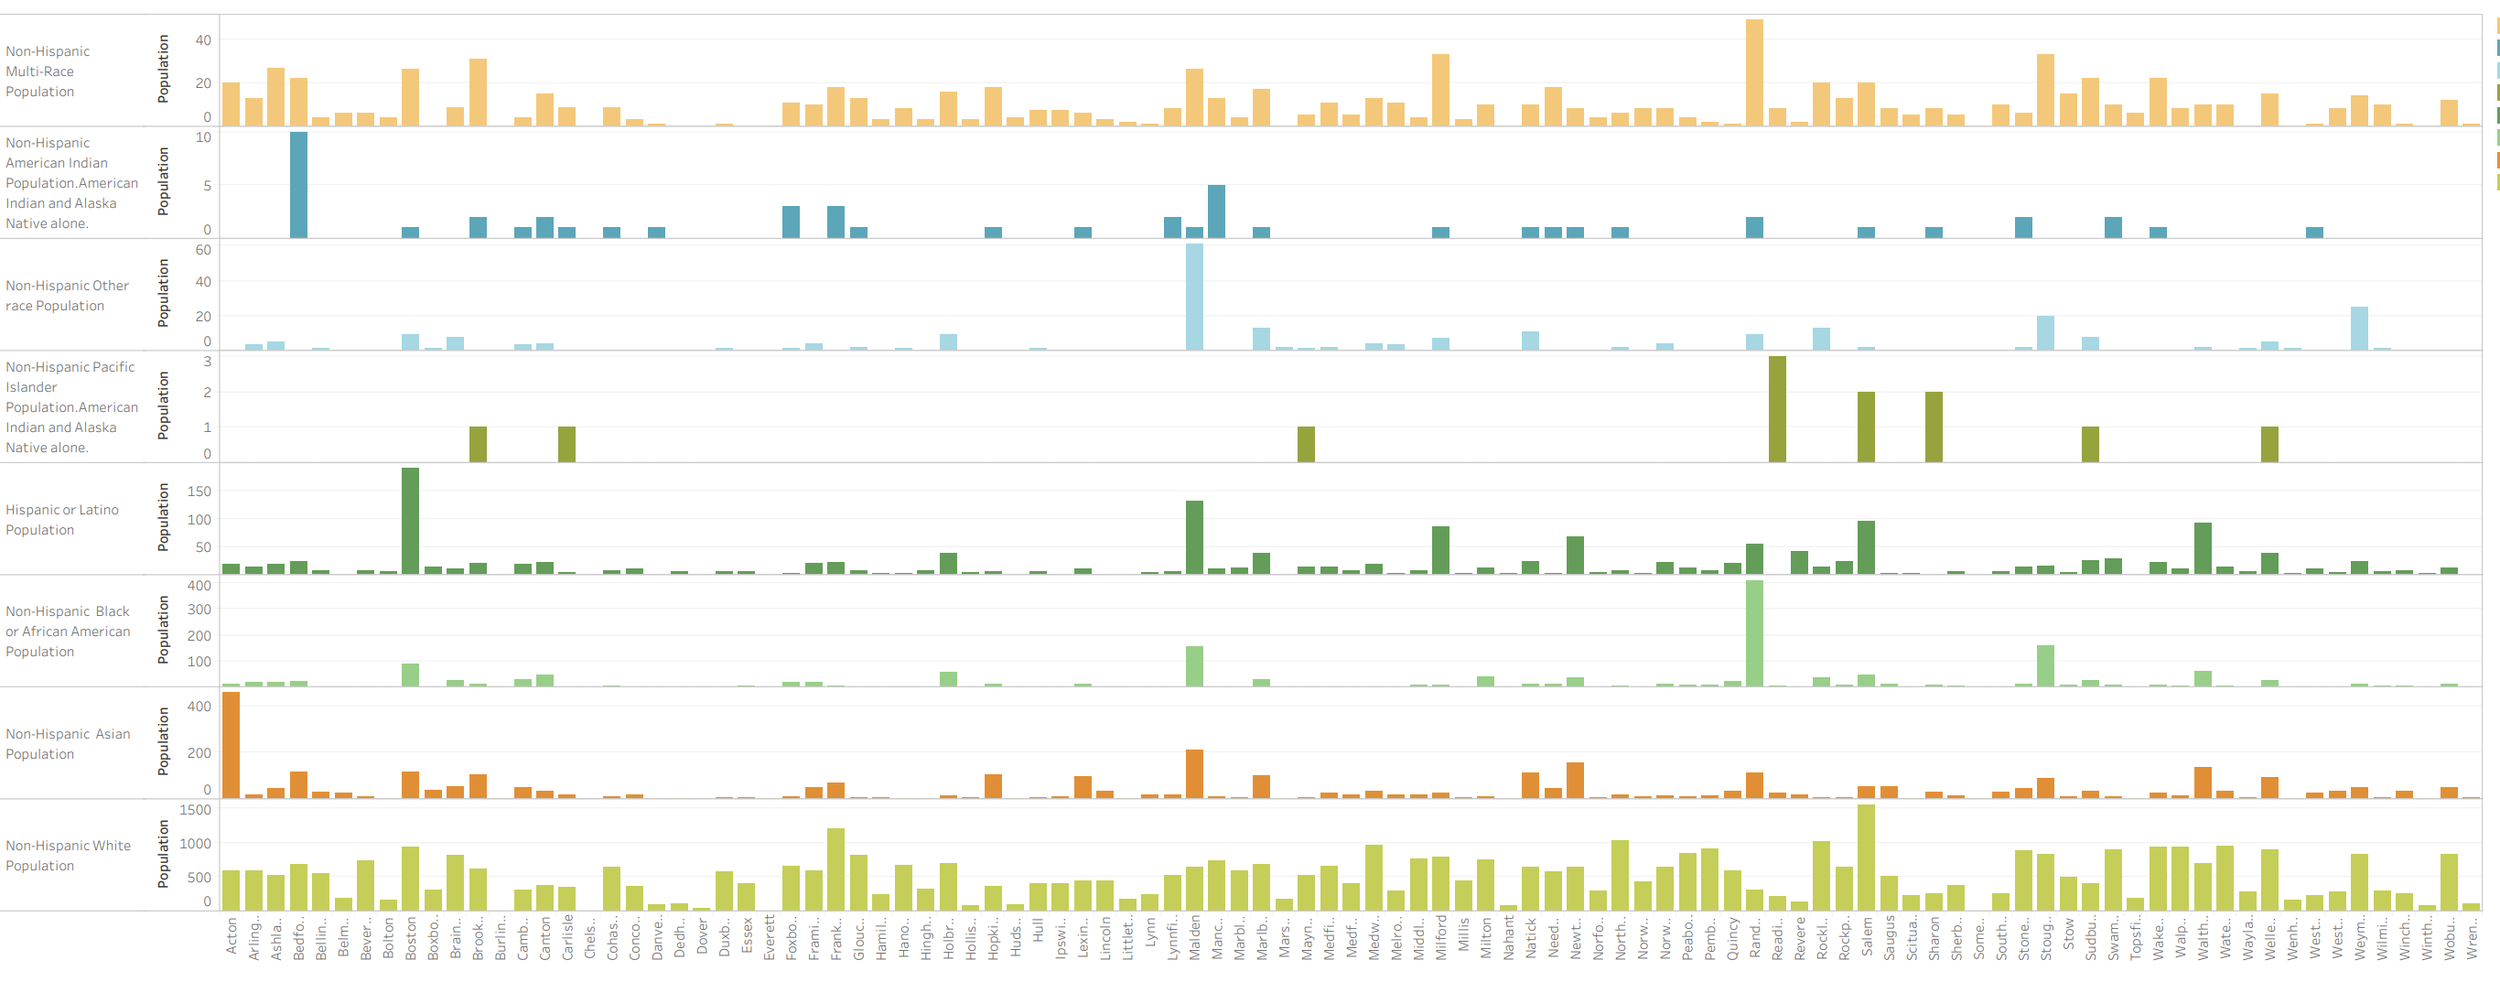
Racial Composition Overview in Metro Boston
Racial and Economic Disparities in Single-Family Zoning
Historically, zoning has been a tool for racial exclusion, and its legacy is still visible in today’s housing patterns. Racial demographics vary widely across Metro Boston, and this figure provides an overview of racial distribution. The persistence of racial disparities suggests that most of the municipalities remain overwhelmingly “white,” while only a few are more diverse, often correlating with housing accessibility and affordability

Correlation Between Single-Family Zoning and White Population Percentage in Metro Boston
This scatter plot analysis examines the relationship between the percentage of both single-family zoning and the white population. A clear pattern emerges: municipalities with high single-family zoning tend to have a higher percentage of white residents. This correlation points to the role of exclusionary zoning in maintaining racial homogeneity, limiting housing access for minority populations.
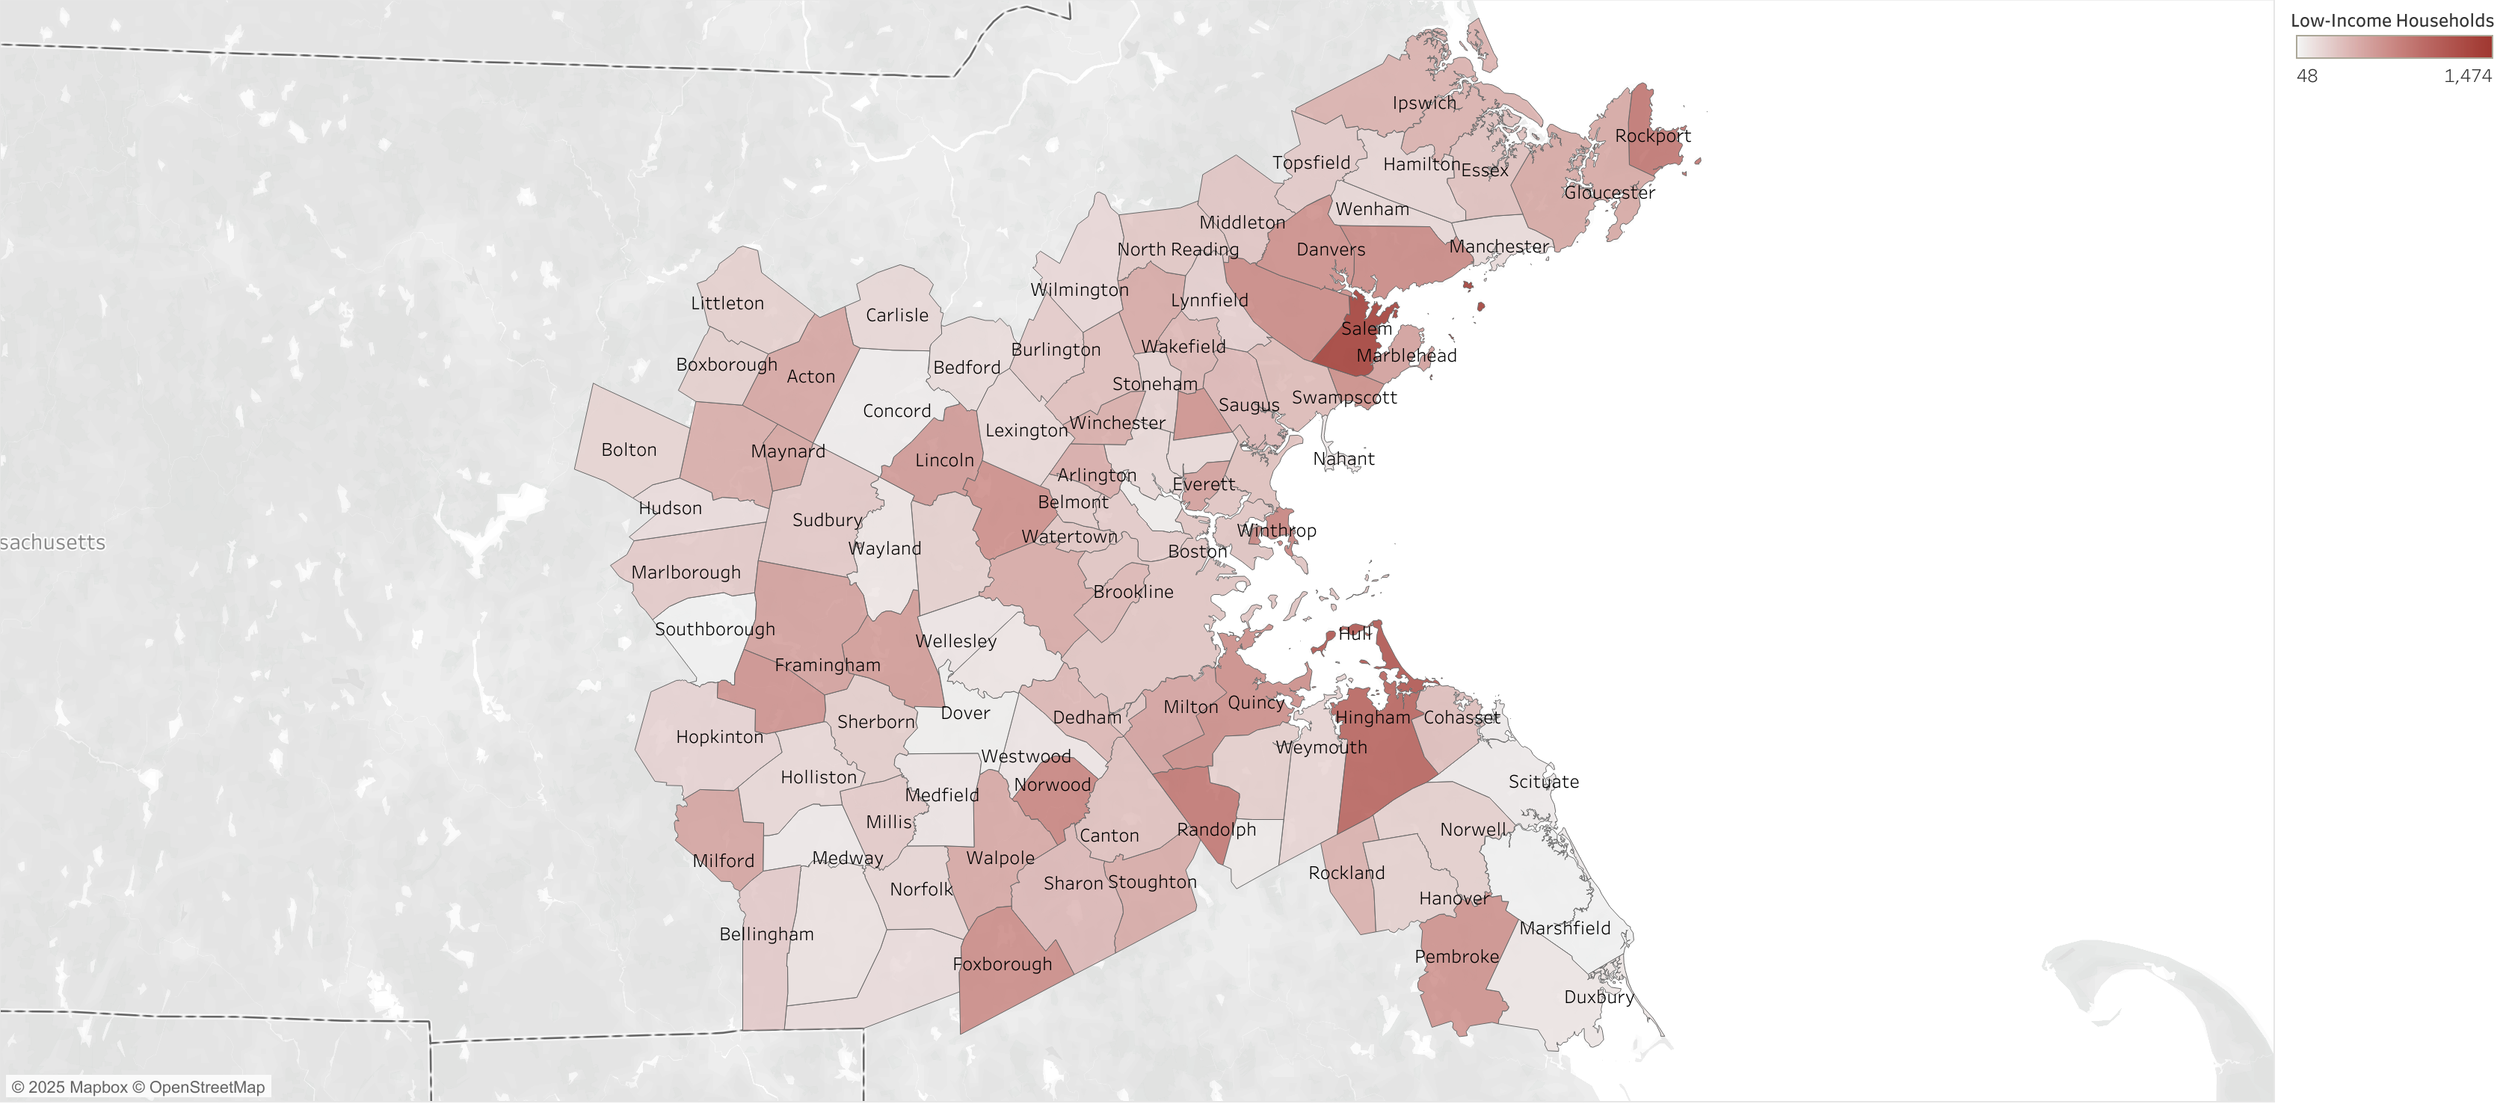
Geographic Distribution of Low-Income Households in Metro Boston
Economic Vulnerability and Zoning Policies
Restrictive zoning policies do more than shape who lives where—they also define where economic hardship is concentrated. Mapping the spatial distribution of low-income households provides an insight into economic segregation. Lower-income residents are often concentrated in municipalities with less restrictive zoning, reinforcing the idea that single-family zoning is a mechanism for economic exclusion.

Relationship Between Low-Income Households and Single-Family Zoning in Metro Boston
Based on the visual patterns in the mapping, municipalities such as Manchester stand out for their high percentage of single-family zoning, with minimal representation of low-income households. These areas exhibit the strongest correlation between restrictive zoning and economic exclusivity. In contrast, Randolph, Salem, and Hull present a lower percentage of single-family zoning and a visibly higher presence of low-income households, representing the notion that flexible zoning policies can accommodate more diverse economic groups. These cases provide clear evidence that single-family zoning can be a powerful determinant of affordability and economic segregation.
By layering zoning policies with income distribution, the data reveals how restrictive zoning reinforces economic segregation. The limited presence of affordable housing types in high single-family zones effectively excludes lower-income populations, shaping not only the built environment but also the socioeconomic landscape of municipalities.
Conclusion: The Structural Impact of Zoning on Housing Equity
This analysis makes clear that single-family zoning is more than just a planning tool—it is a key driver of economic and racial segregation in Metro Boston. The data shows that municipalities with high rates of single-family zoning tend to be wealthier, less diverse, and less accessible to non-traditional households. At the same time, lower-income residents and minority populations are disproportionately concentrated in areas with more flexible housing policies.
While zoning reform alone won’t solve the region’s housing crisis, addressing exclusionary policies is a necessary step toward creating more equitable and inclusive communities. Allowing for more diverse housing types—such as duplexes, townhomes, and multi-family units—can provide opportunities for younger residents, low-income families, and minority households to access better housing and economic mobility.
By taking a data-driven approach, we can move beyond anecdotal arguments and visualize how zoning policies actively shape the social and economic landscape of our cities. The findings underscore the urgent need for policy reforms that prioritize affordability, diversity, and access to opportunity across all communities.